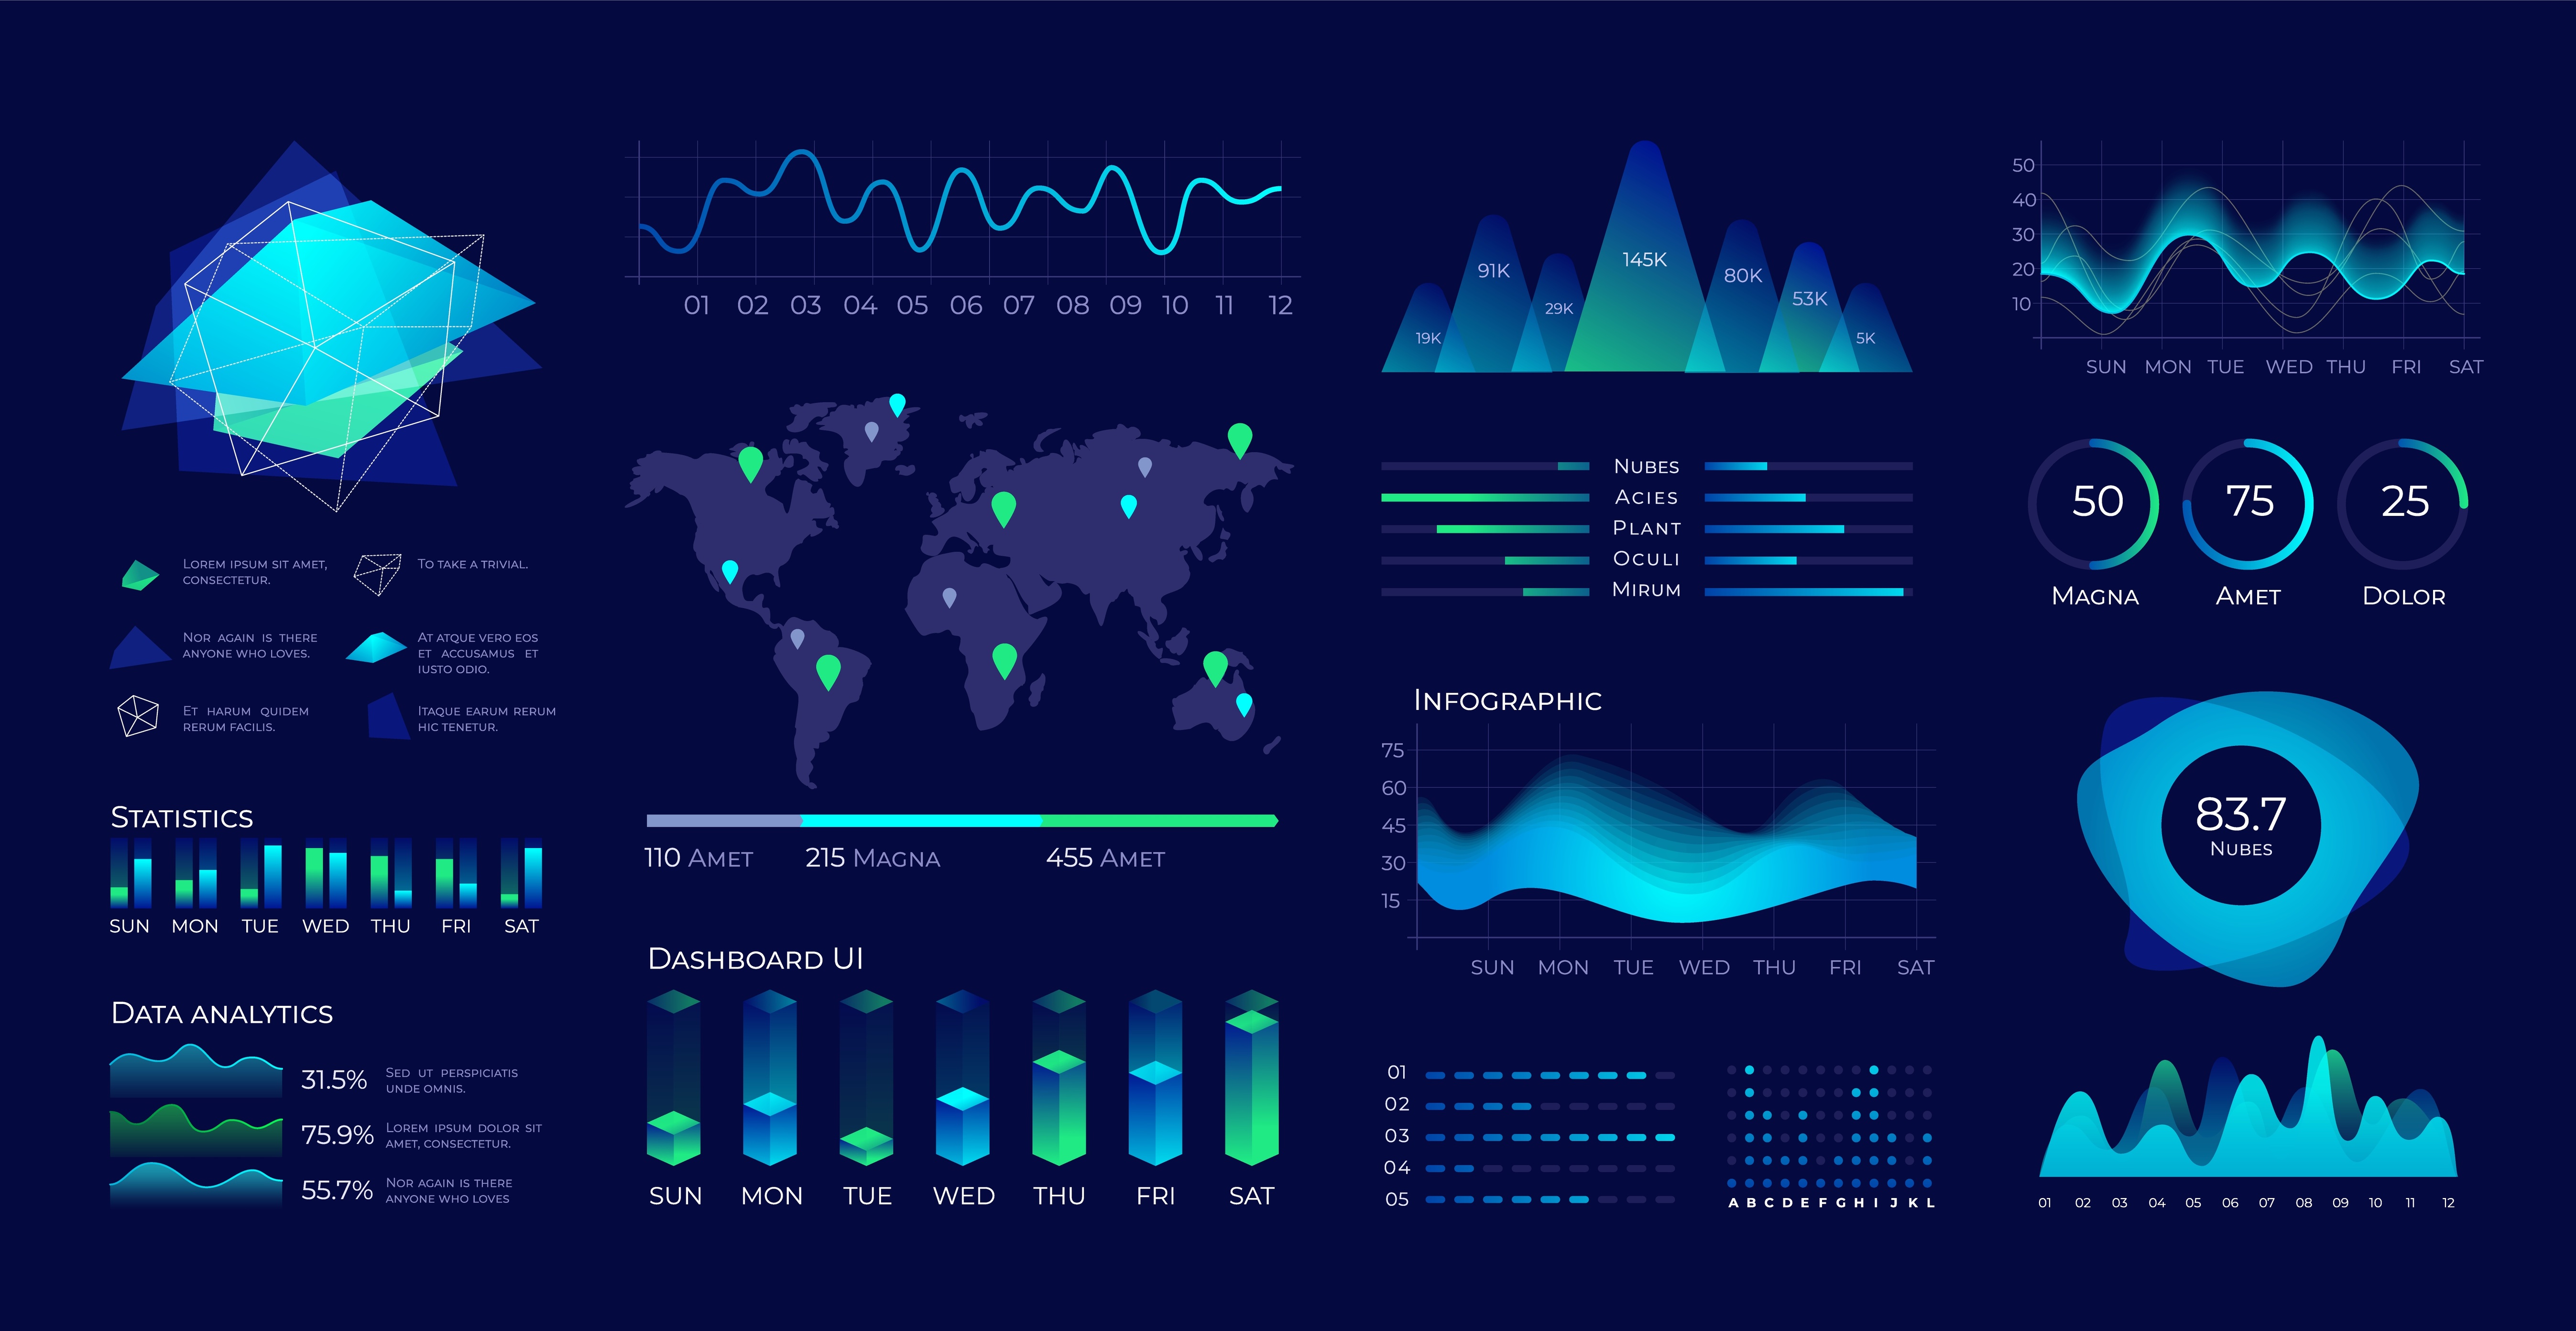
Power BI projects focus on using Microsoft’s robust data visualization and business intelligence platform to transform raw data into meaningful, interactive reports and dashboards. These projects typically involve collecting and cleaning data from multiple sources, building efficient data models, and leveraging Power BI’s intuitive tools to create visuals that communicate insights effectively. From tracking business performance and analyzing customer behavior to monitoring key operational metrics, the Power BI projects I have worked on span a wide range of industries and use cases, helping organizations make data-driven decisions with greater clarity and impact. Below are some of the projects.
My PowerBI world:
My vast knowledge on powerBI has made me realise that they are so many beautiful things i can learn how to do and still work on when it comes Data visualisation and Analysis with powerBI and Tableau. I always wake up to know more and learn.
Employee-insights Dashboard
The dashboard provides a clear view about the location of each bussinesses across the country region, it also describe the breakdown of the employee such as the Employement type, Age group, pay type, gender and the ethnic groups they all belong to, along with the growth of employee hired over the course of the year. It also talks about the key employee indicator breakdown where it shows the total number of employees at each cost centre,thier average salary,average tenor(years)spent, total leave balances.It also pin pointed the sick day balance evaluation, also estimated the total salary cost. With the aid of this dashboard you can easily understand how the workforce actually works in any country

Insurance Application Insights
This PowerBI Dashboard for This Insurance Application, aims to address challenges by providing a dynamic, interactive visualization that consolidates critical insurance data into a single and clear view platform. By integrating real-time analytics, trend forecasting, and performance tracking of every single individual that applied to get insured. With this dashboard, it will empower more people to be applying for insurance and also allow stakeholders to make data-driven decisions, enhance operational efficiency, and improve financial outcomes. With a focus on clarity, accessibility, and actionable intelligence, this solution will transform raw data into strategic insight, helping insurers stay competitive in an evolving market and forsee the future benefits it will provide when they get insured

Customer Deep Dive
Understanding customer behavior is difficult when data is scattered across different systems and regions. Information such as customer numbers, purchasing roles, regional distribution, and buying trends is often reported inconsistently, making it hard for leaders to see a clear picture of the consumer base. Without a centralized tool, it is difficult for managers to track how customer engagement changes over time. The Customer Deep Dive Dashboard solves this by bringing fragmented data into one place, standardizing key measures, and providing a unified view of customer demographics and sales performance to support better decision-making